financial reporting systems
ssas multidimensional-to-tabular migration without downtime, automated reconciliation, and azure reporting pipelines.
up to 200× faster filtering · ~4× faster excel loading
previously microsoft · university of virginia
i build data systems, simulations, and interactive tools. my recent independent work spans robot control, language-model components, and graphics.
open to full-time engineering roles and technical collaborations.
explore the work ↓ssas multidimensional-to-tabular migration without downtime, automated reconciliation, and azure reporting pipelines.
tableau analytics products, sql metric definitions, deployment, and operational support.
implementations, experiments, and current limits.
six-legged locomotion learned with PPO.
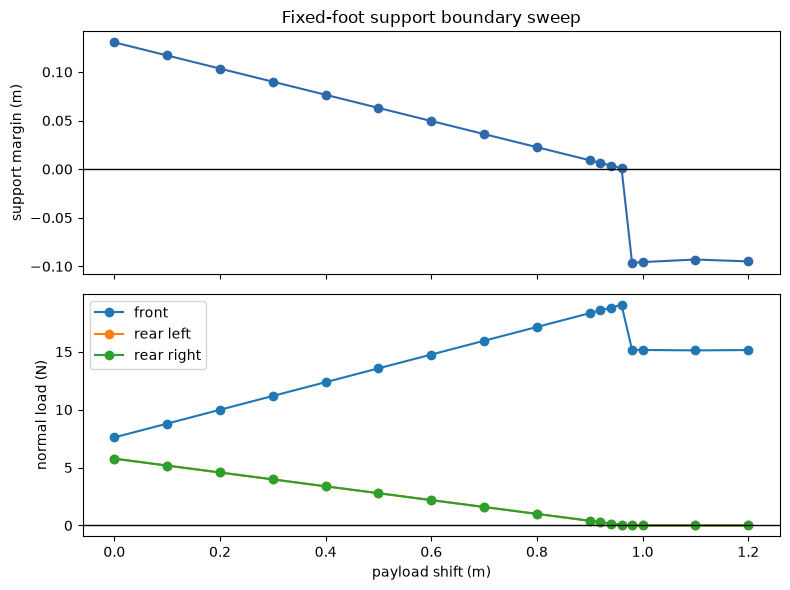
walk_fast_500 reaches 0.888 m/s in the recorded mean-policy run, with 0 falls across 24 fixed flat-ground evaluations. PPO learns joint corrections and gait cadence. compare the preserved policies in the film.
scopefoot slip and contact fragmentation remain. · terrain, push recovery, and energy efficiency are unproven.
talk about this project ↗feedback, coupled joints, foot placement, and contact. six experiments with code, recorded results, and limits.
explore the six experiments ↗byte-pair tokenizer, bigram language model, and causal attention in pytorch.
byte-pair tokenization, bigram, attention, and transformer components in pytorch. the examples below are preserved notebook outputs from revision 19222f1.
scopein these recorded examples, attention is checked at the block level and the trained model is the bigram baseline. newer source work includes a transformer comparison harness.
talk about this project ↗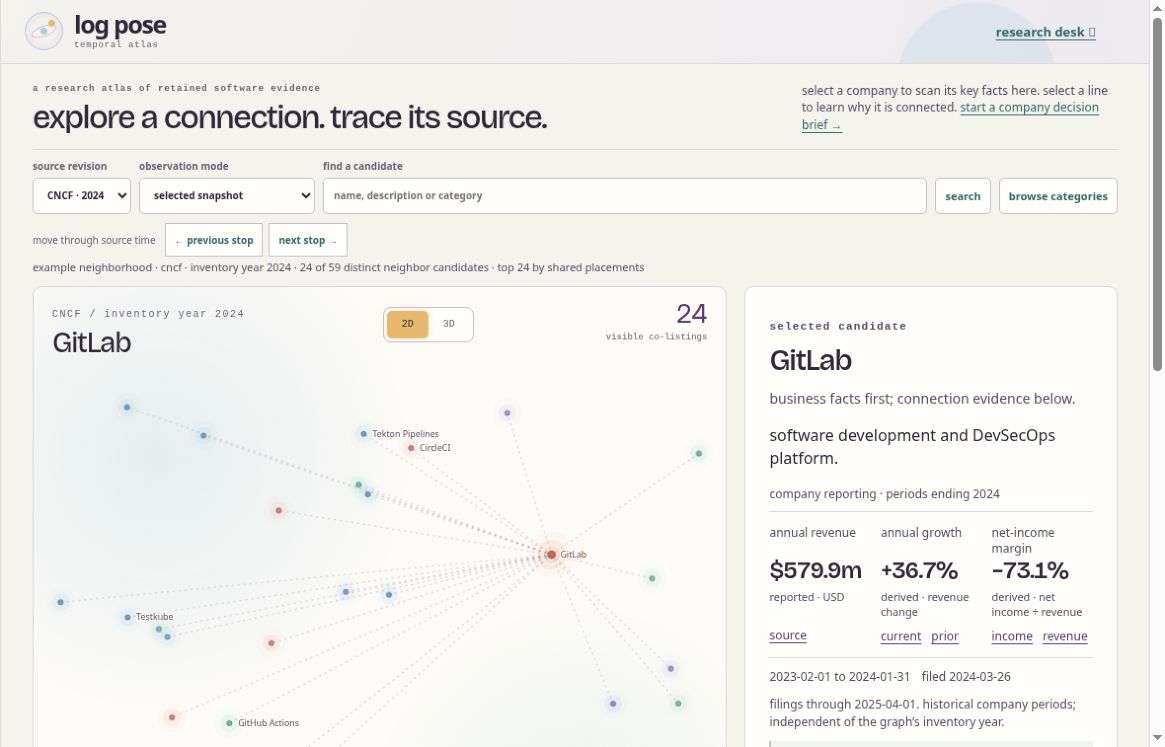
dated software-market evidence, from source capture to graph exploration.
python ingestion preserves source hashes, capture dates, and arrival times in postgresql. a read-only graph API connects pinned inventory co-listings to their exact retained records, with dated search and source audits in the browser.
scopeco-listings are source observations, not verified company relationships or market share.
talk about this project ↗
tournament data, player ratings, and a nightly pipeline.
tournament results feed a nightly duckdb/dbt pipeline with glicko-2 ratings. the dashboard validates shadow-database rebuilds before promotion, with a direct-write fallback. its experimental deck estimates use bayesian shrinkage and approximate 90% model intervals that exclude baseline uncertainty and dependence between cards.
talk about this project ↗interactive fourier reconstruction of drawn curves.
drawn 2d curves are reconstructed with rotating vectors. the interface exposes the periodic seam and normalized rms reconstruction error.
scopeerror is measured against the input curve.
talk about this project ↗project preview · open the full app for audio response
audio-reactive webgl jellyfish.
procedural mantle, filaments, oral arms, and accretion disk. local files or captured tab audio drive the full application, with separate playback and visual-intensity controls.
scopethe black-hole lensing is an artistic approximation. this page shows the silent version; the full app responds to audio.
talk about this project ↗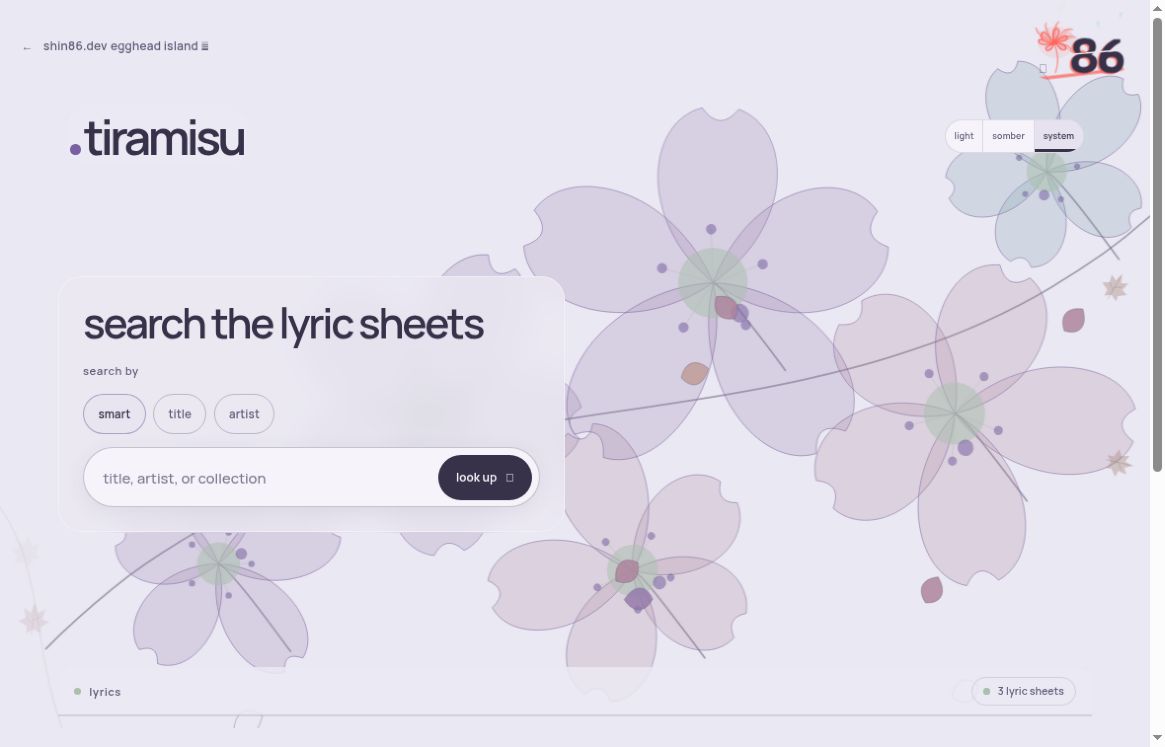
a searchable lyric-sheet reader with focus mode and Genius annotations.
plain-text lyrics sit beside a decorative p5 cherry-blossom canvas, with focus mode and a separate panel for public Genius lyric annotations. reading remains usable without animation.
talk about this project ↗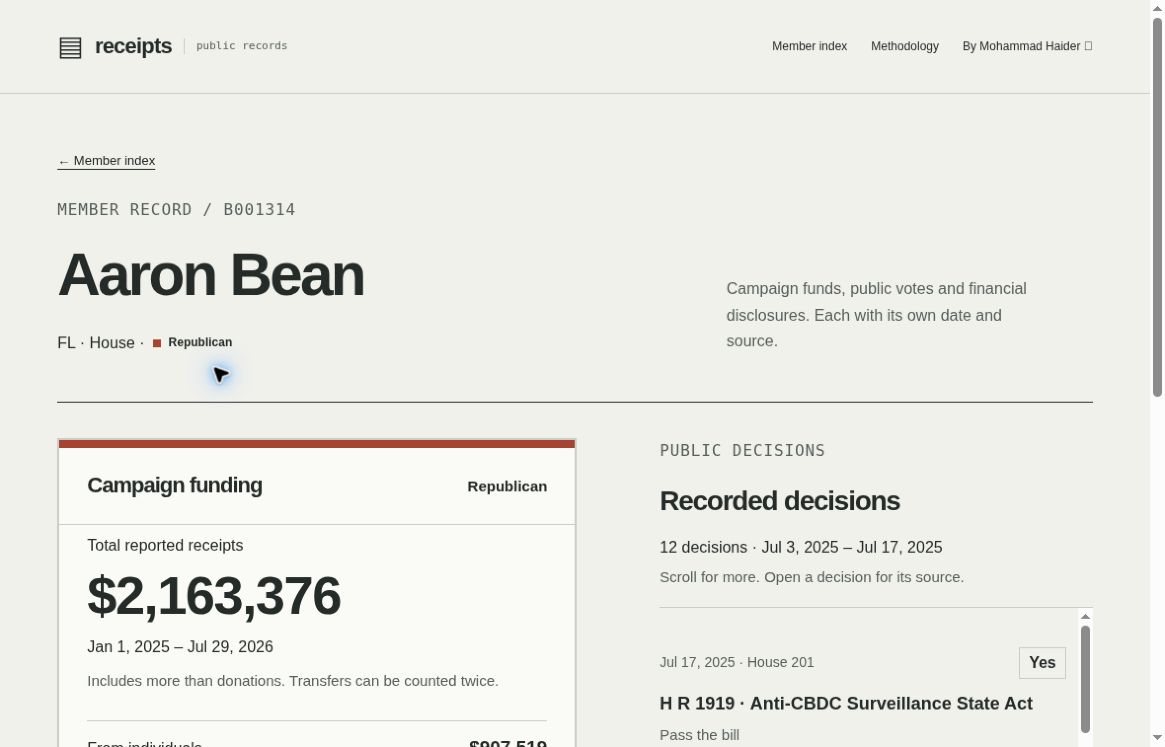
campaign funding and recorded decisions, with public sources.
browse 539 congress members and 532 campaign finance summaries. inspect dated funding, matched roll calls, selected financial disclosures, and candidate comparisons with links to the official records.
scopebundled dated snapshots, not live feeds. votes and disclosures have limited stated coverage; missing data stay unknown. these records do not establish motive or influence.
talk about this project ↗i’m mohammad, based in charlottesville, virginia. i studied statistics at virginia tech (go hokies!) and spent four years working on production data systems and internal tools.
i built and supported tableau products, wrote metric definitions in sql, and contributed to work that improved dashboard load time by about 20%. the reuse reporting covered environmental and economic impact and reached over 400 views.
i migrated financial reporting from ssas multidimensional to tabular with zero downtime. i also built automated reconciliation and azure pipelines. filtering improved by up to 200×, and excel loading by about 4×.
i have a b.s. in statistics from virginia tech. during microsoft internships in 2017 and 2018, i worked on internal tools, including a onedrive recent-items service in c#.
python / typescript / c# / sql / r / .net / azure / tableau / mujoco / three.js / numpy / pandas / jupyter / git
the longer writeups, executed notebooks, and resumes are here.
hiring for a team, working on a related problem, or seeing a connection i haven’t? i’d like to hear about it.
music, art, and little places to get lost.